Graphic Designer
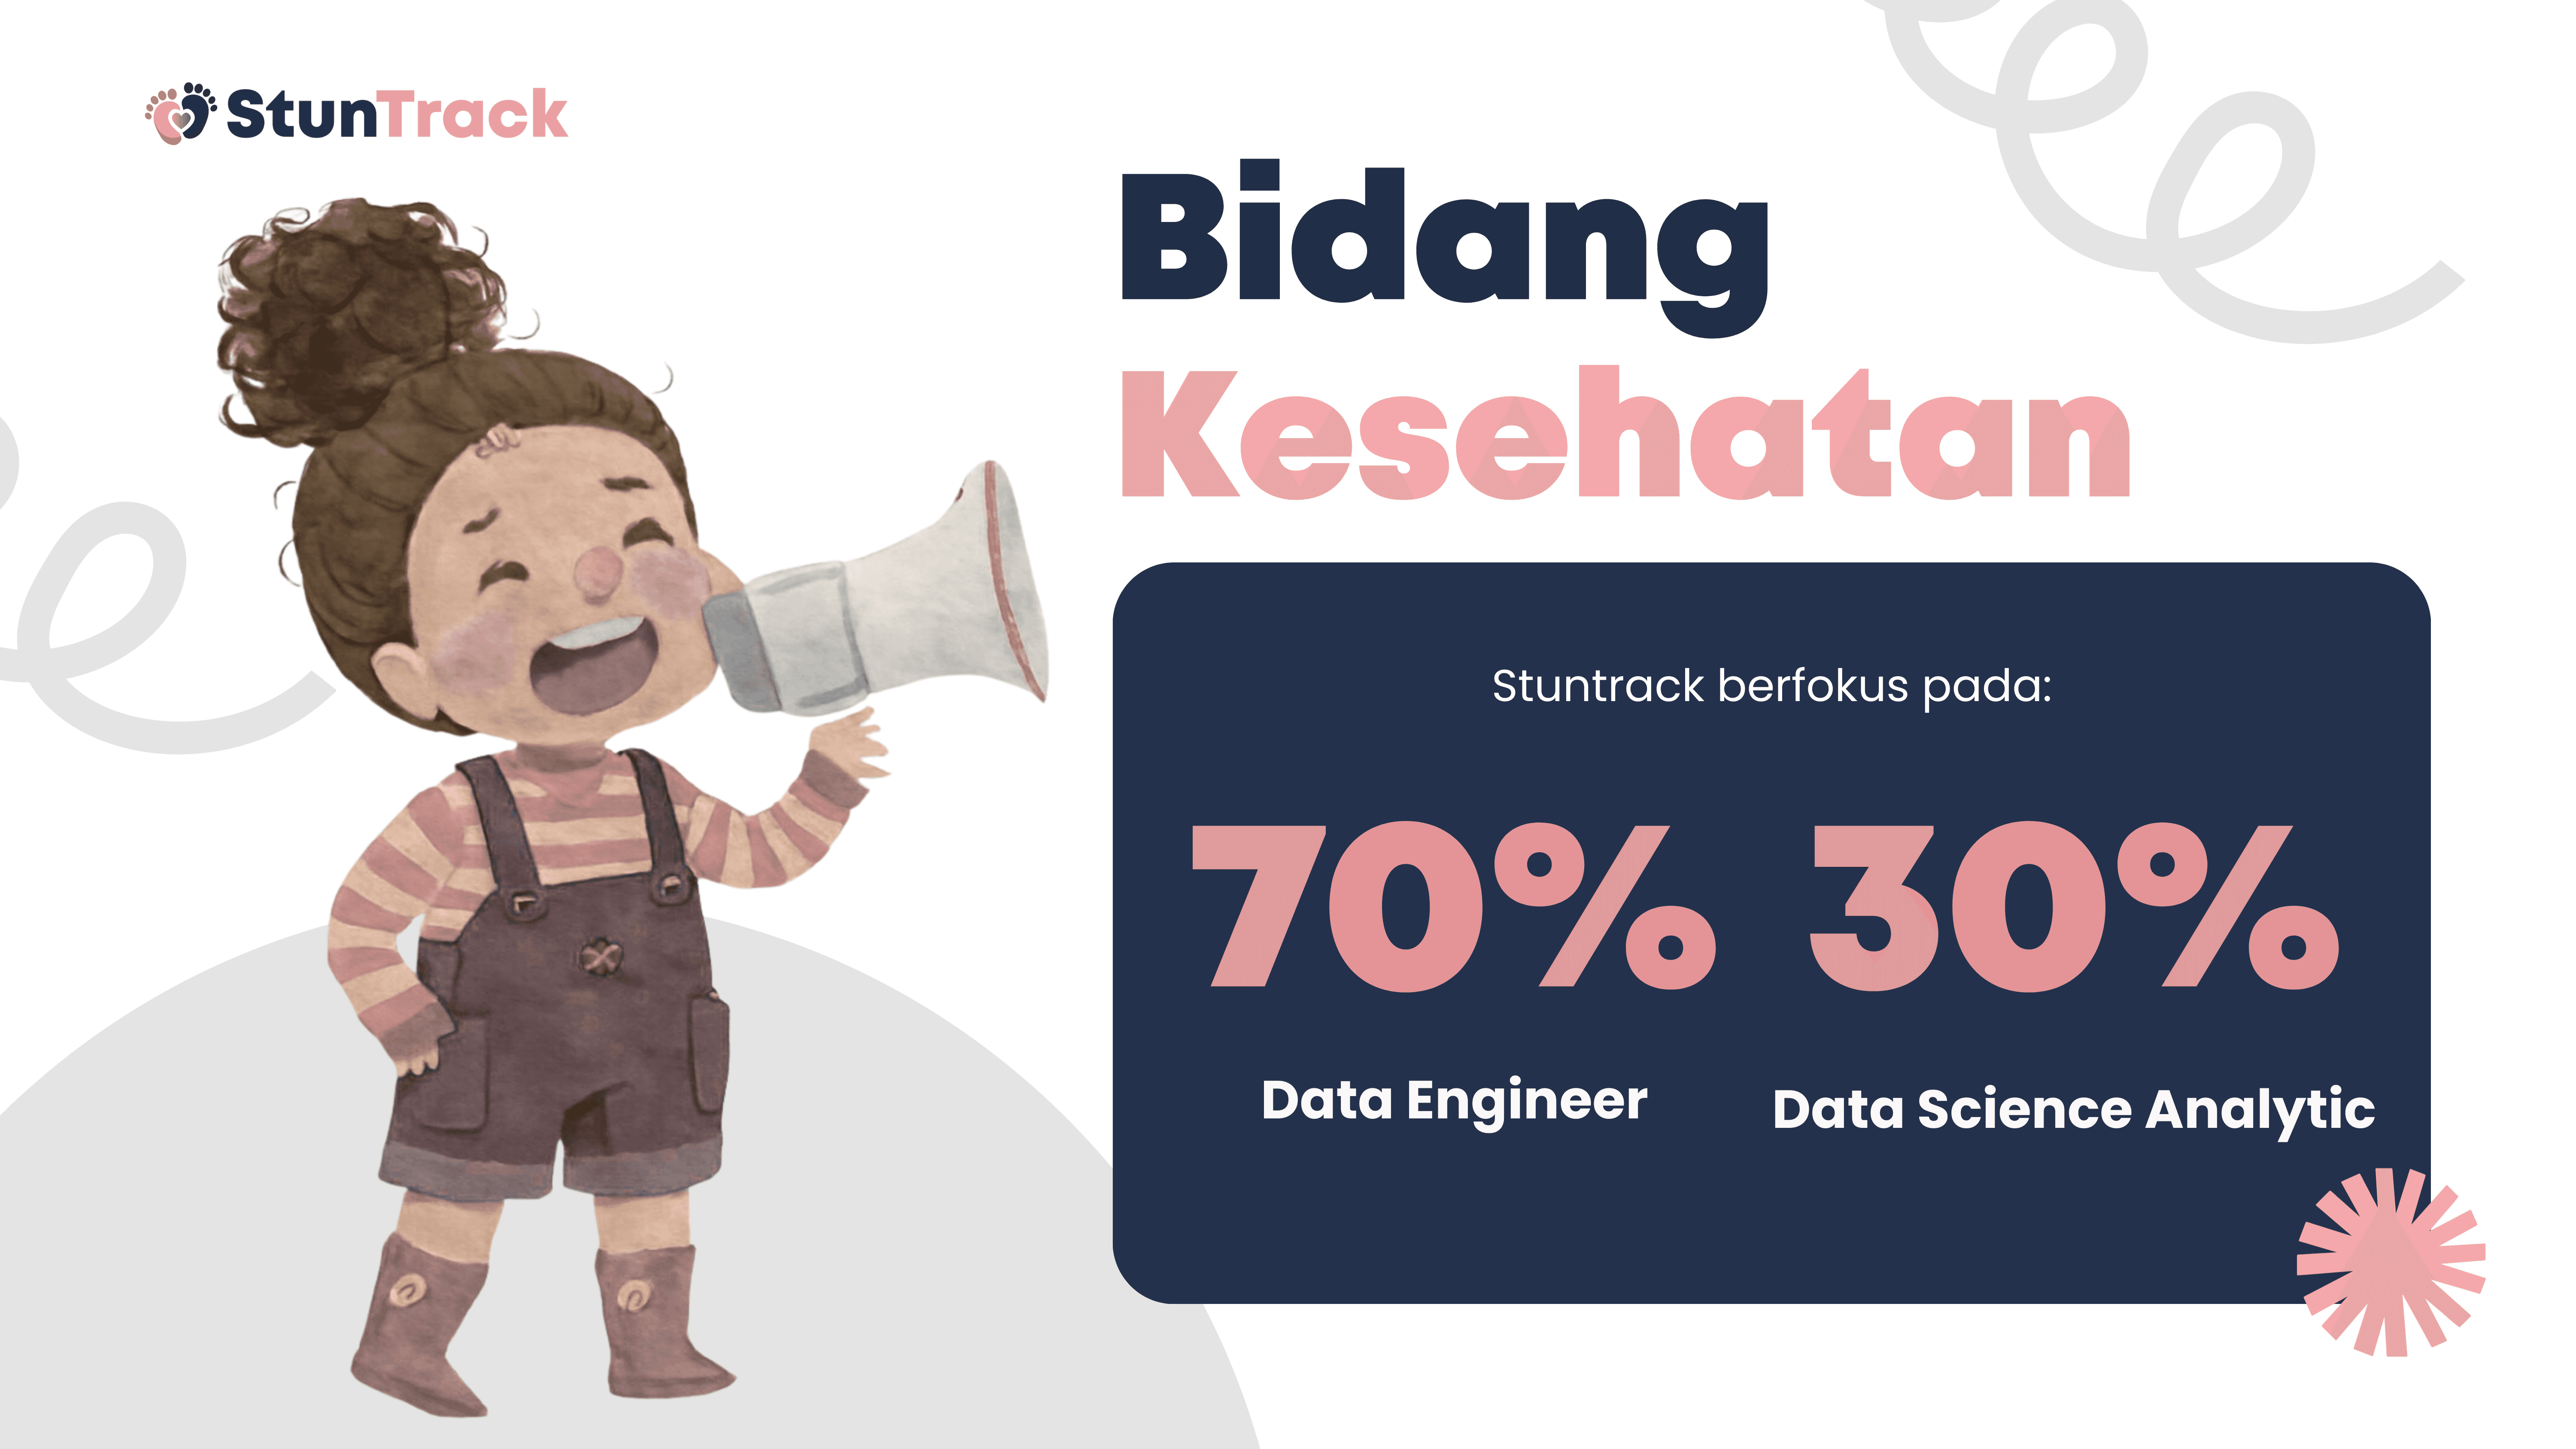
Data Engineer
Website Developer
Graphic Designer
Data Engineer
Website Developer
Graphic Designer
Data Engineer
Website Developer
Graphic Designer
Data Engineer
Website Developer
Graphic Designer
Data Engineer
Website Developer
Graphic Designer
Data Engineer
Website Developer
Graphic Designer
Data Engineer
Website Developer

2025
2025
Stunting Tracking
Stunting Tracking
Stunting Analysis using Flask HTML CSS
Dashboard Pet Care Business
using Node JS HTML CSS

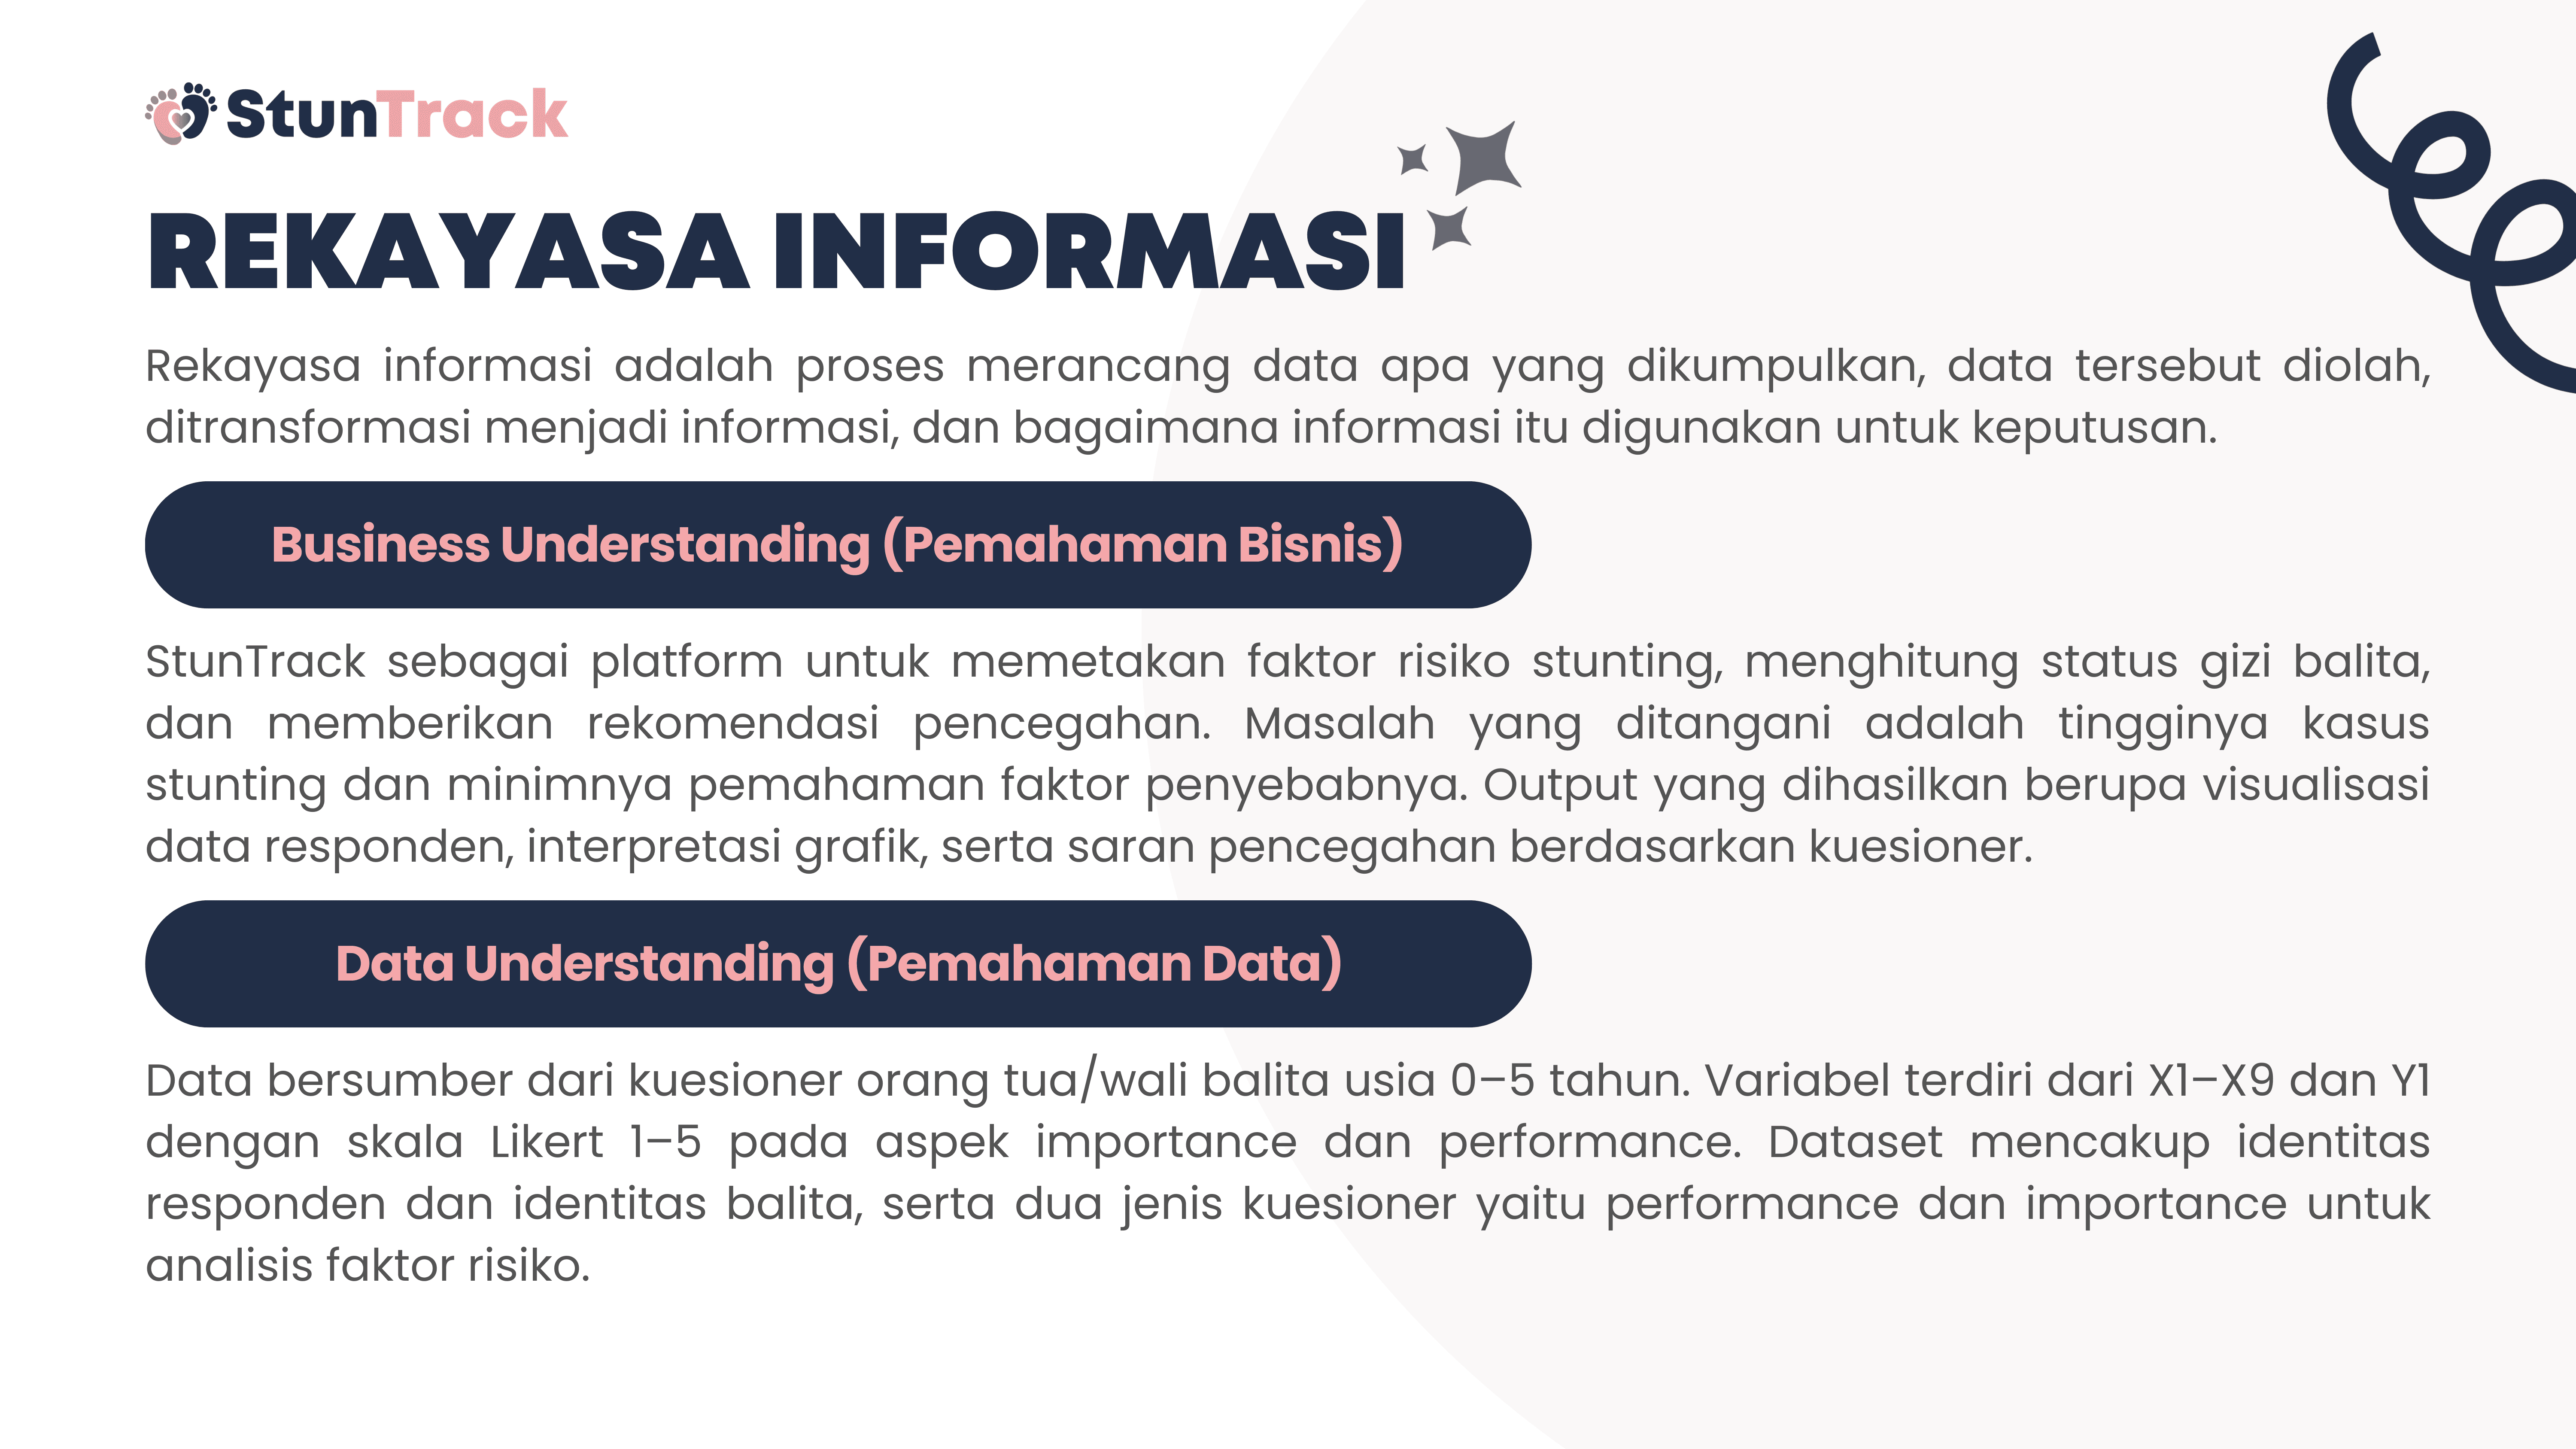
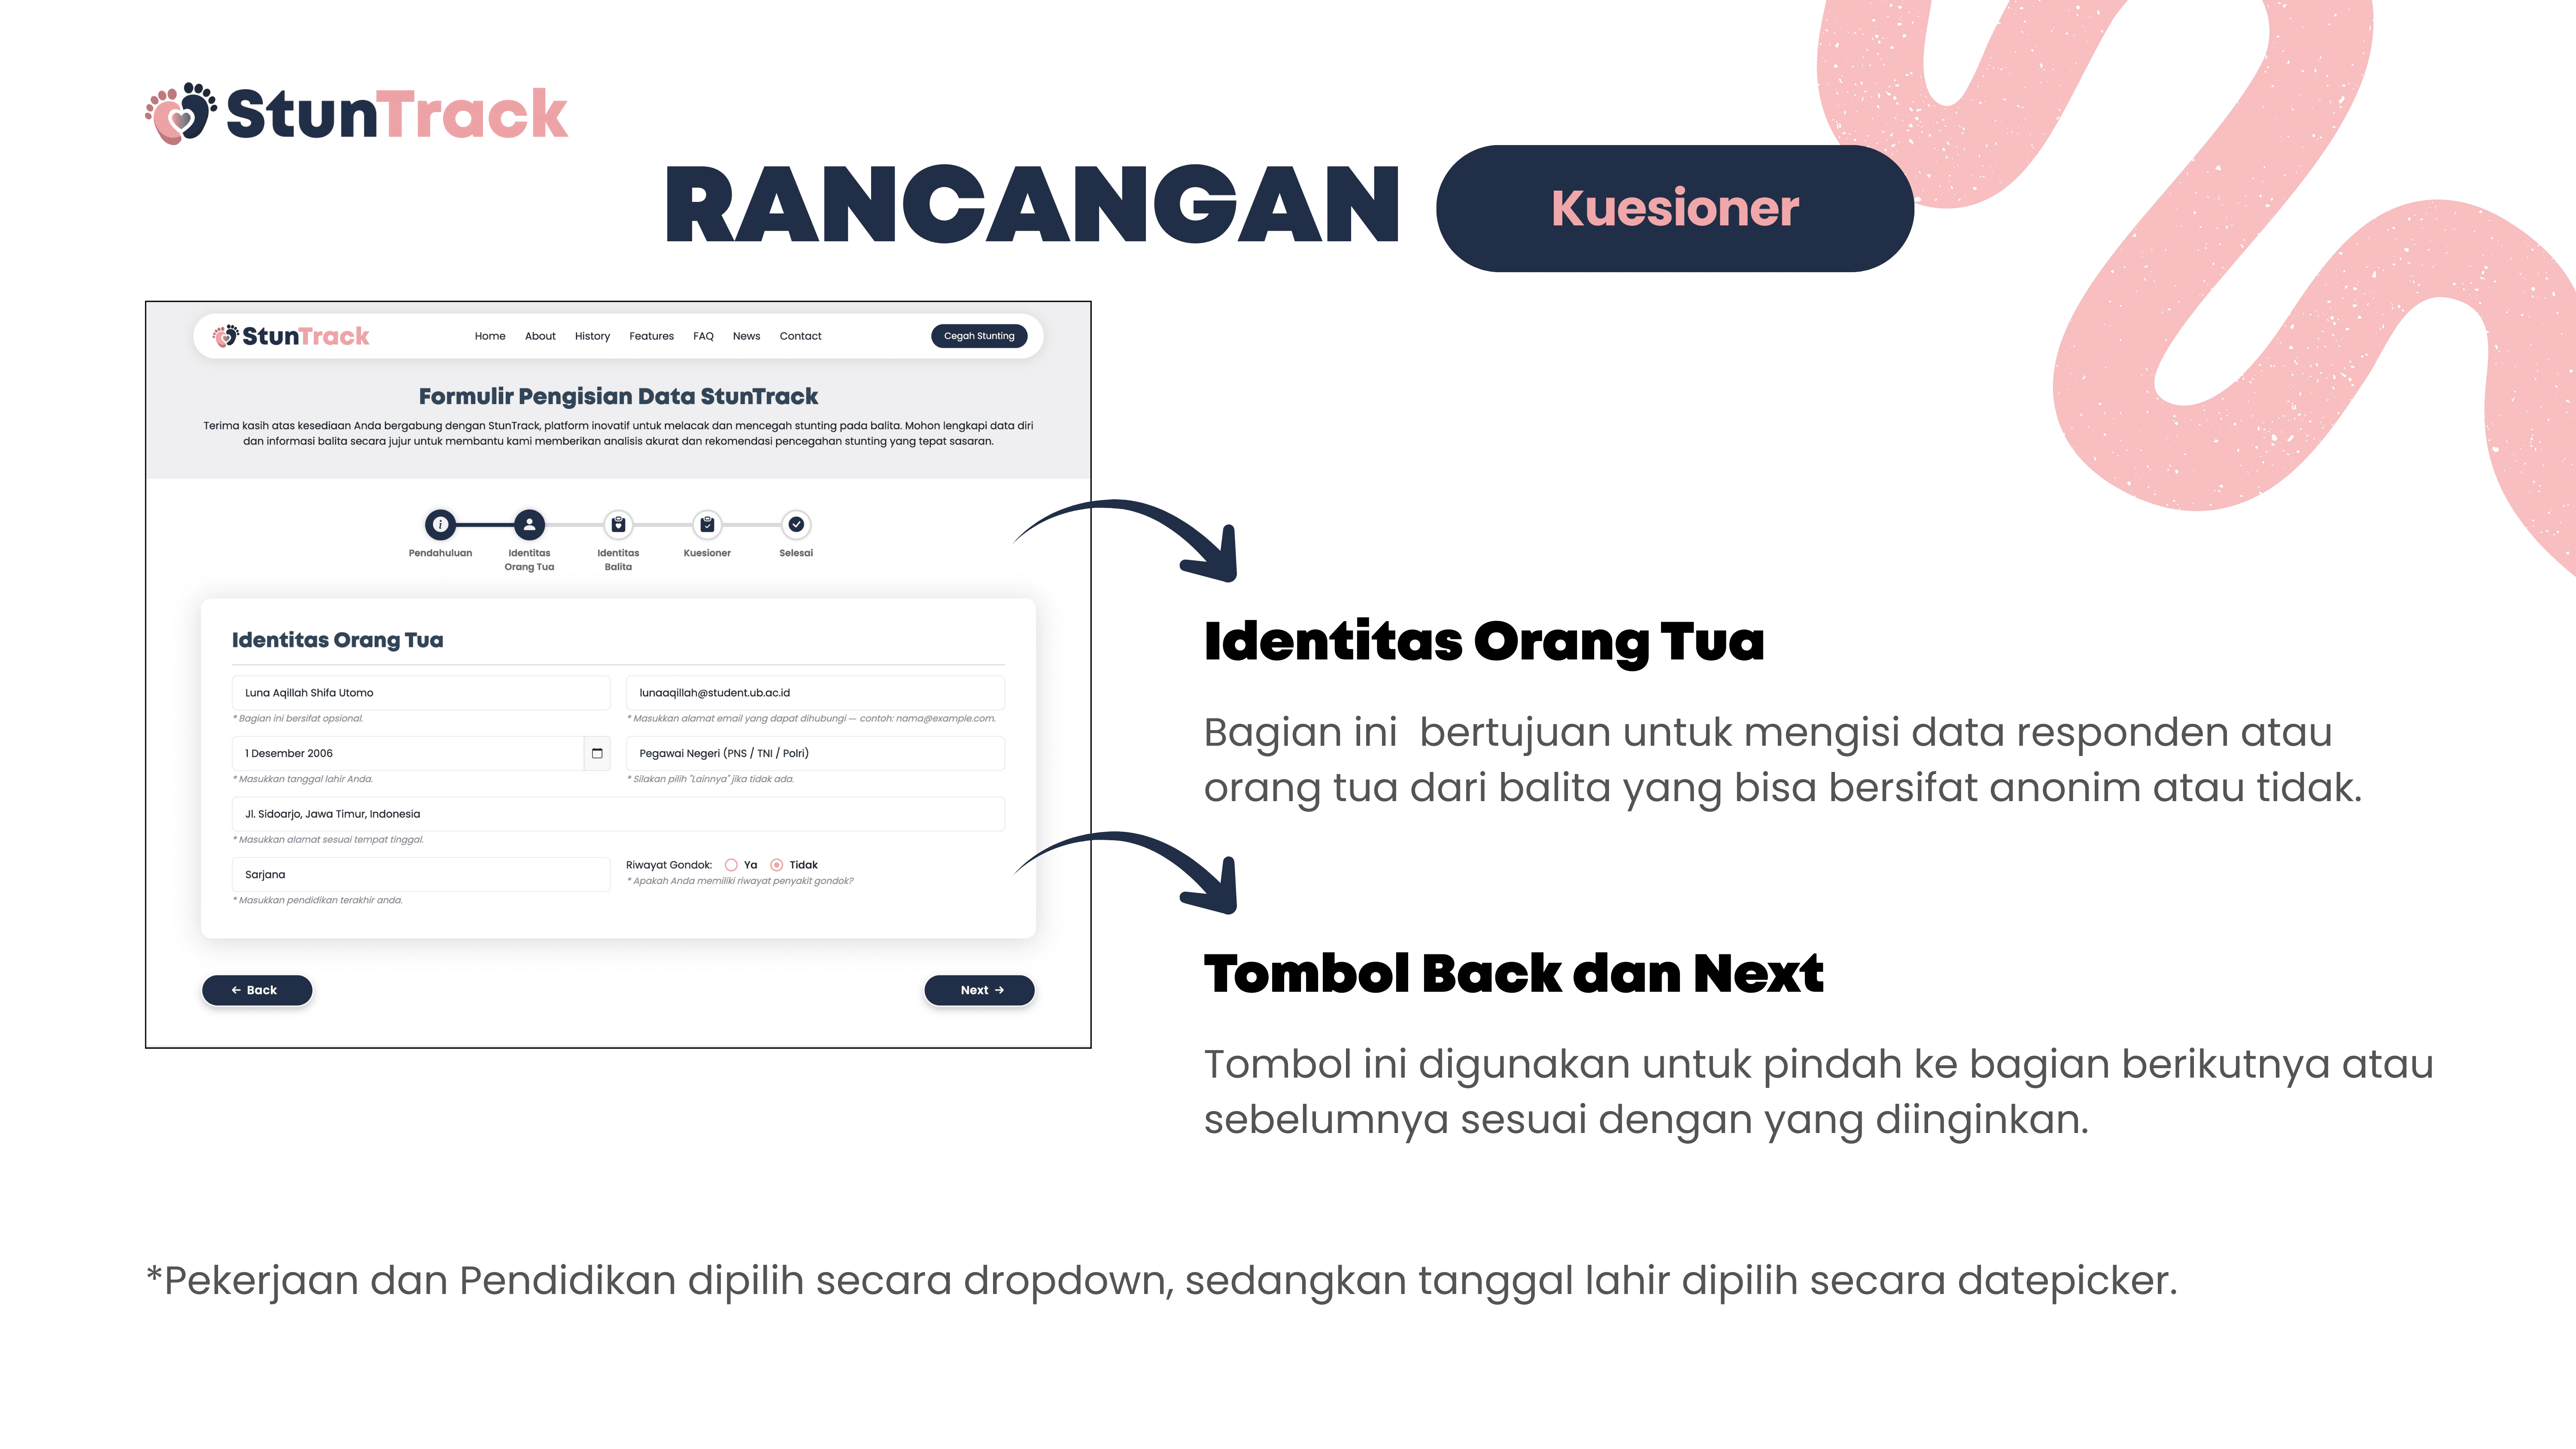
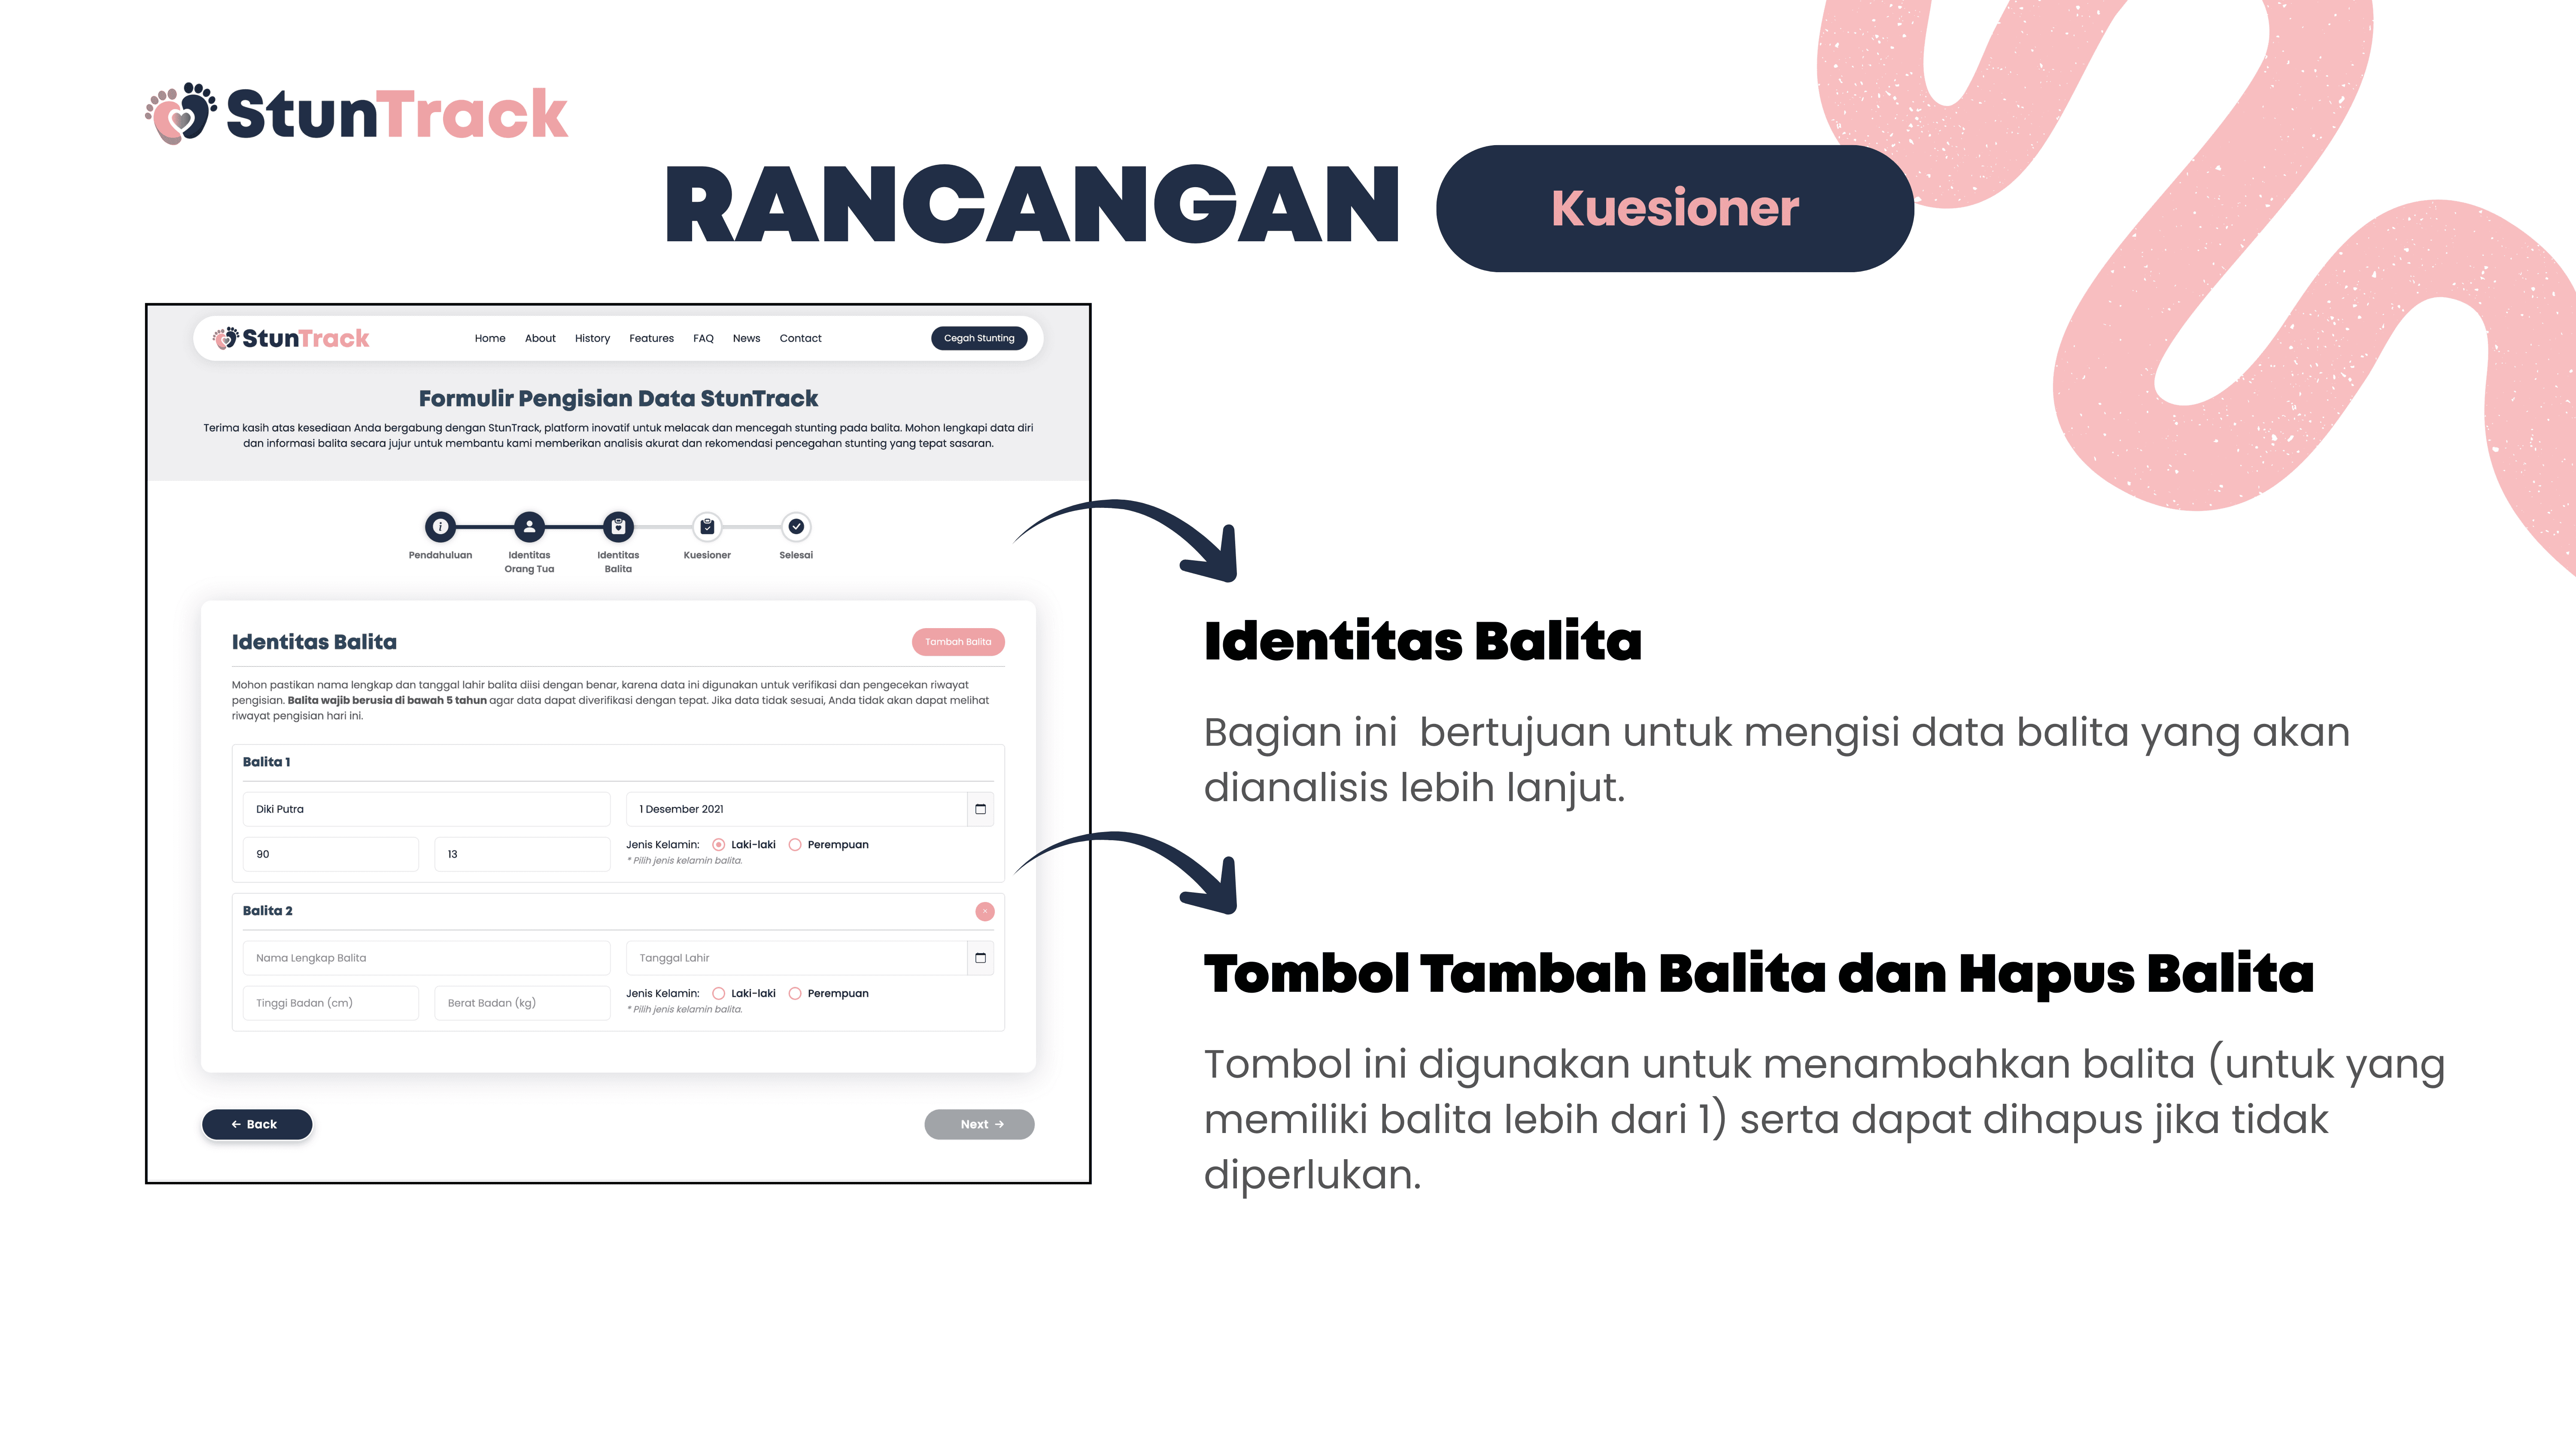
This project is about building StunTrack, a web-based platform to track, analyze, and help prevent stunting in children aged 0–5 years. The system aims to process questionnaire data from parents or guardians to determine nutritional status, identify key stunting risk factors, and generate data-driven recommendations
Using Flask and Python, the data is collected, processed, and stored in a centralized SQLite database, while HTML, CSS, and JavaScript are used for the user interface. Data is visualized with Chart.js and delivered through automated email reports, helping health workers and families monitor child growth and make more informed decisions.


Thank You
Thank You
Thank You
Thanks for taking the time to check out my process. I’m glad if it gave you some helpful insights. I’m excited to share more soon! Feel free to reach out if you have any questions or feedback.
Thanks for taking the time to check out my process. I’m glad if it gave you some helpful insights. I’m excited to share more soon! Feel free to reach out if you have any questions or feedback.
Thanks for taking the time to check out my process. I’m glad if it gave you some helpful insights. I’m excited to share more soon! Feel free to reach out if you have any questions or feedback.


